Electricity Costs
Understanding the Couts Electricite page — cost breakdowns by category, sensor, and tariff.
The Couts Electricite (Electricity Costs) page lives under Optimisations in the sidebar. It translates your consumption data into monetary terms, showing where your electricity budget goes.
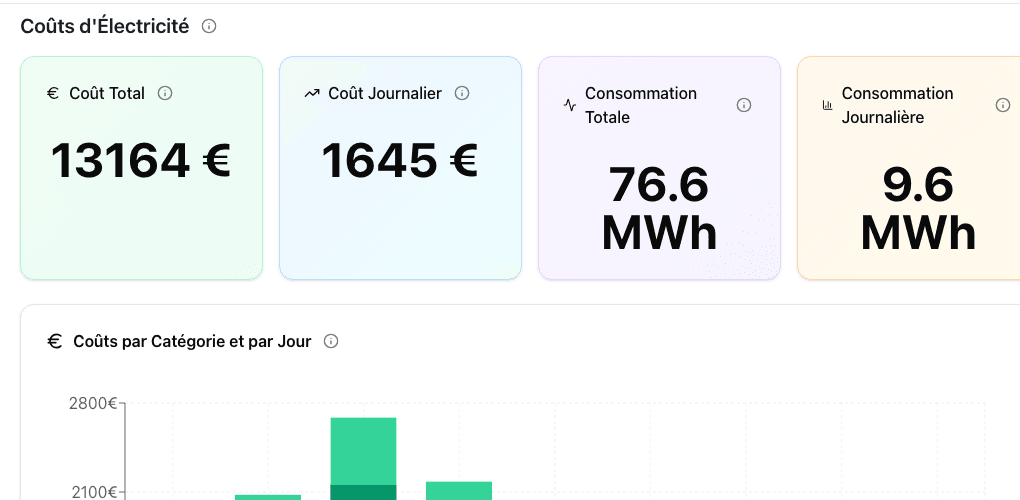
Stat cards
| Card | French label | What it shows |
|---|---|---|
| Total Cost | Cout Total | Total electricity cost for the selected period (EUR) |
| Daily Cost | Cout Journalier | Average cost per day (EUR) |
| Total Consumption | Consommation Totale | Total energy consumed (kWh/MWh) |
| Daily Consumption | Consommation Journaliere | Average daily consumption (kWh) |
Couts par Categorie per Giorno (Costs by Category per Day)
A stacked bar chart showing daily costs broken down by equipment category (Eclairage, CVC, Froid, Prises, Causes Energetivores, Refrigeration, Autre). Each bar represents one day, and the color segments show how much each category contributed.
Use this chart to:
- Spot which days are most expensive
- Identify which equipment categories dominate your costs
- Detect unexpected cost spikes tied to specific categories
Costi per Sensore (Costs by Sensor)
A detailed breakdown showing costs attributed to individual sensors. Useful when you need to pinpoint exactly which piece of equipment is driving costs.
Repartition des Couts per Tariffa (Tariff Breakdown)
This section shows costs split between tariff periods:
| Tariff | French | When | Rate |
|---|---|---|---|
| Off-peak | Heures Creuses | Typically nights and weekends | Lower |
| Peak | Heures Pleines | Typically business hours on weekdays | Higher |
For each tariff period, the breakdown shows energy consumed (kWh) and cost (EUR).
Cost-saving opportunity
If a large share of consumption happens during Heures Pleines, shifting load to Heures Creuses is a direct cost-saving opportunity. Use the Savings Simulator to quantify the impact.
When to use this page
| Use case | What to look at |
|---|---|
| Monthly cost reviews | Total cost card and daily cost chart |
| Tariff optimization | Tariff breakdown section |
| Equipment cost attribution | Costs by sensor view |
| Budget forecasting | Daily cost patterns over time |